Containerized self-managed FEK stack
Long story short: I was working on a microservice that’s full of spaghetti codebase(it’s a fact not an opinion, SONAR report says that), architecture and unclear logs. Logs are vital IMHO, thought of starting with improving logs(Not just log statement, but searchability, log analytics etc) and todo that first I need a similar kinda setup in my local to do dry runs.
Here is my local setup. This post aims at setting things up and doesn’t talk about the log analytics and dashboards etc.
At high level this post details out the Beats(FileBeat) -> Elastic -> Kibana setup with docker-compose.
Here is the docker-compose.yml
# @author: sairaghava_k
services:
  elasticsearch:
    image: elastic/elasticsearch:8.16.3
    hostname: elasticsearch
    container_name: elasticsearch
    environment:
      - "discovery.type=single-node"
      # ElasticSearch by default runs in multi-node cluster
      # This setting tells Elastic to disable node discovery and run as single node
      - "ES_JAVA_OPTS=-Xms512m -Xmx512m"
      - xpack.security.enabled=false # Disable only when working in local envs
    ports:
      - "9200:9200"
      - "9300:9300"
    volumes:
      - esdata:/usr/share/elasticsearch/data

  filebeat:
    image: elastic/filebeat:8.16.3
    hostname: filebeat
    container_name: filebeat
    volumes: # Check this: https://www.elastic.co/guide/en/beats/filebeat/current/running-on-docker.html#_run_filebeat_on_a_read_only_file_system
      # Have the filebeat.yml in your PWD
      - "./filebeat.yml:/usr/share/filebeat/filebeat.yml:ro" # RO meaning read only(Linux Terminology)
      - ".local/logs:/usr/share/filebeat/srk-app/logs"
      - filebeat-data:/usr/share/filebeat/data
    depends_on:
      - elasticsearch # ensure that it matches the servicename

  kibana: # Read: https://www.elastic.co/guide/en/kibana/current/docker.html
    image: elastic/kibana:8.16.3
    hostname: kibana
    container_name: kibana
    ports:
      - "5601:5601"
    environment:
      - ELASTICSEARCH_HOSTS=["http://elasticsearch:9200"]
    volumes:
      - kibanadata:/usr/share/kibana/data
    depends_on:
      - elasticsearch # ensure that it matches the servicename

volumes: # docker-volumes
  esdata:
  filebeat-data:
  kibanadata:

networks:
  default:
    name: srk-local-filebeat-elastic-kibana-network
-
Here is my
filebeat.ymlconfiguration# @author: sairaghava_k filebeat.inputs: - type: log enabled: true paths: # Filebeat: Where are my logs that I should push to ElasticSearch? - /usr/share/filebeat/srk-app/logs/*.log # Filebeat -> elasticsearch config # For config options refer: https://www.elastic.co/guide/en/beats/filebeat/current/elasticsearch-output.html output.elasticsearch: hosts: [ "http://elasticsearch:9200" ] index: "srk-log-index" # This is my index to filter the srk-app logs similar to SPLUNK/GrayLog index # Read: https://www.elastic.co/guide/en/beats/filebeat/current/configuration-template.html # Setup settings setup: ilm: # Index LifeCycle Management(ILM) enabled: false # Disables ILM to avoid '.ds-*' indexes # ds(Data Stream) is not required unless we are testing in production-lke performance template: name: "srk-log-index" # should match the index name pattern: "srk-log-index-*" # suffix is important for Kibana to pull logs from ES settings: index: # For single node elasticsearch and for indexes without replicas number_of_shards: 1 number_of_replicas: 0 processors: - dissect: # Assume if your log is un-structured like plain text with a format like # 2025-02-09 18:36:12 | INFO | main | io.github.sairaghavak.Main:blogPostFEK:3 | visitor_uuid=asd-c123-123asdf | country=IN | visit_count=1 | Welcome to the blog and thanks for reading. Good Luck. tokenizer: "%{timestamp} | %{log_level} | %{thread_name} | %{class_method_line_number} | visitor_uuid=%{visitor_uuid} | country=%{country} | visit_count=%{visit_count} | %{msg}" # Meaning this file beat will extract the values are key:val paris and put under a json node dissect # timestamp=2025-02-09 18:36:12 # log_level=INFO # thread_name=main # class_method_line_number=3 # visitor_uuid=asd-c123-123asdf # country=IN # visit_count=1 # msg=Welcome to the blog and thanks for reading. Good Luck. field: "message" # Each log line is read and set as the value to the key "message" ignore_failure: true # meaning if any of the keys are not found it's a fail safe instruction -
Spin up all the services
-
docker-compose up -d
- Here are my services from Rancher
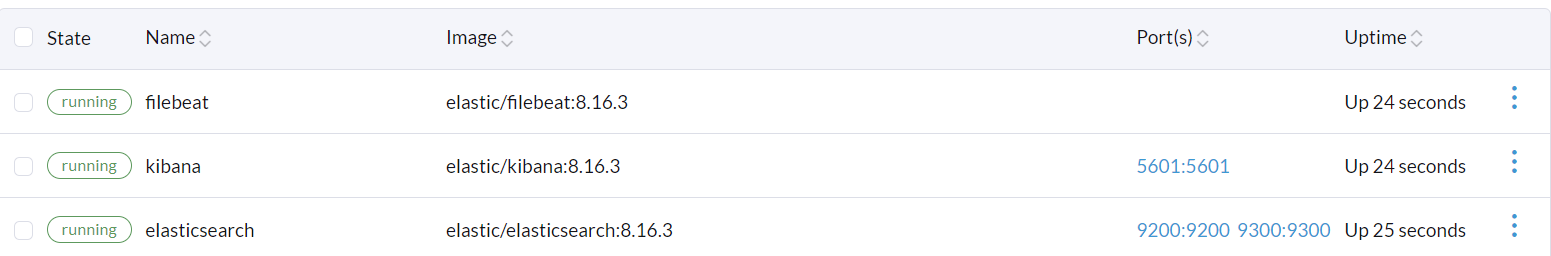
- Named volumes
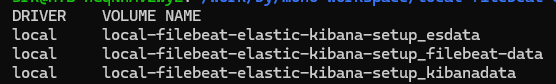
- Dedicated network for all these services

-
Verification of Setup #
- Check if
filebeathas your log file- login to
filebeatdocker exec -it filebeat /bin/bash
- And go to path
/usr/share/filebeat/srk-app/logs- Should have the file
srk.log-> This is a bind mount from disk to container -
cat srk.log
- Should have the file
- login to
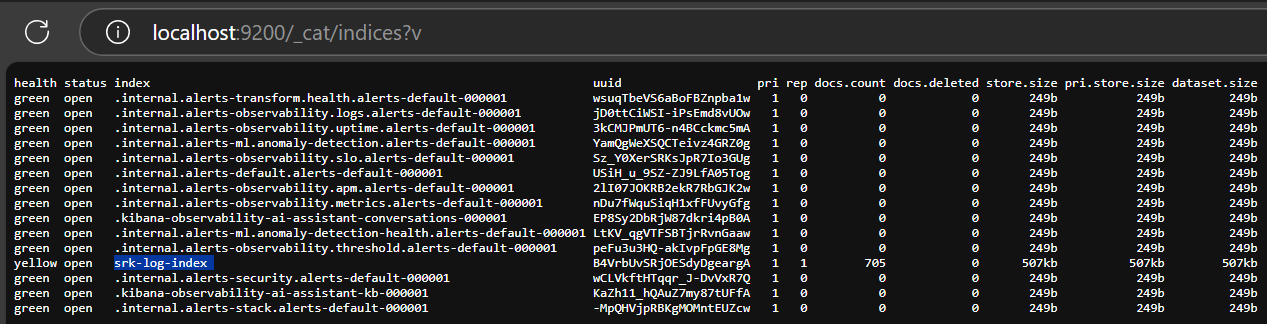
- Check if elastic search has received your log file and indexed?
- First get the all the indices in elasticsearch
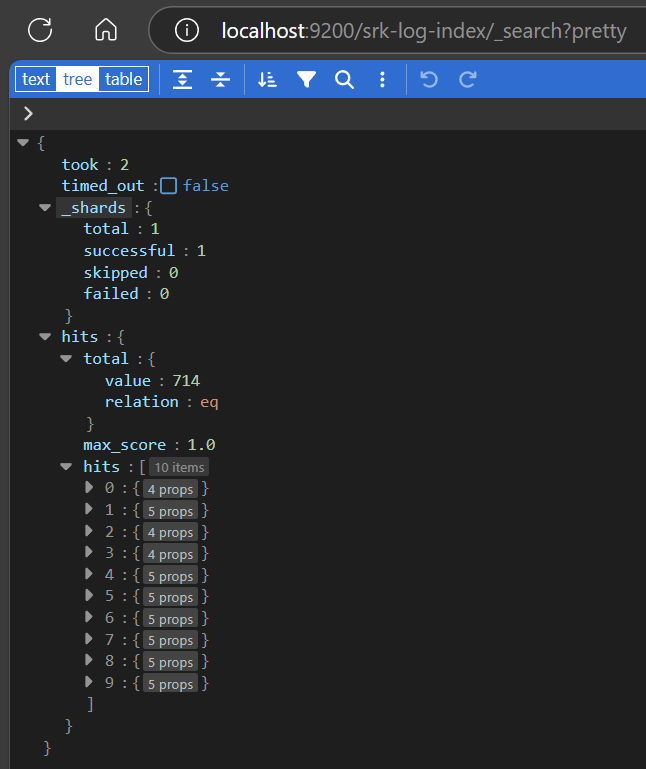
- Search the logs under your index
- Verify the logs in Kibana
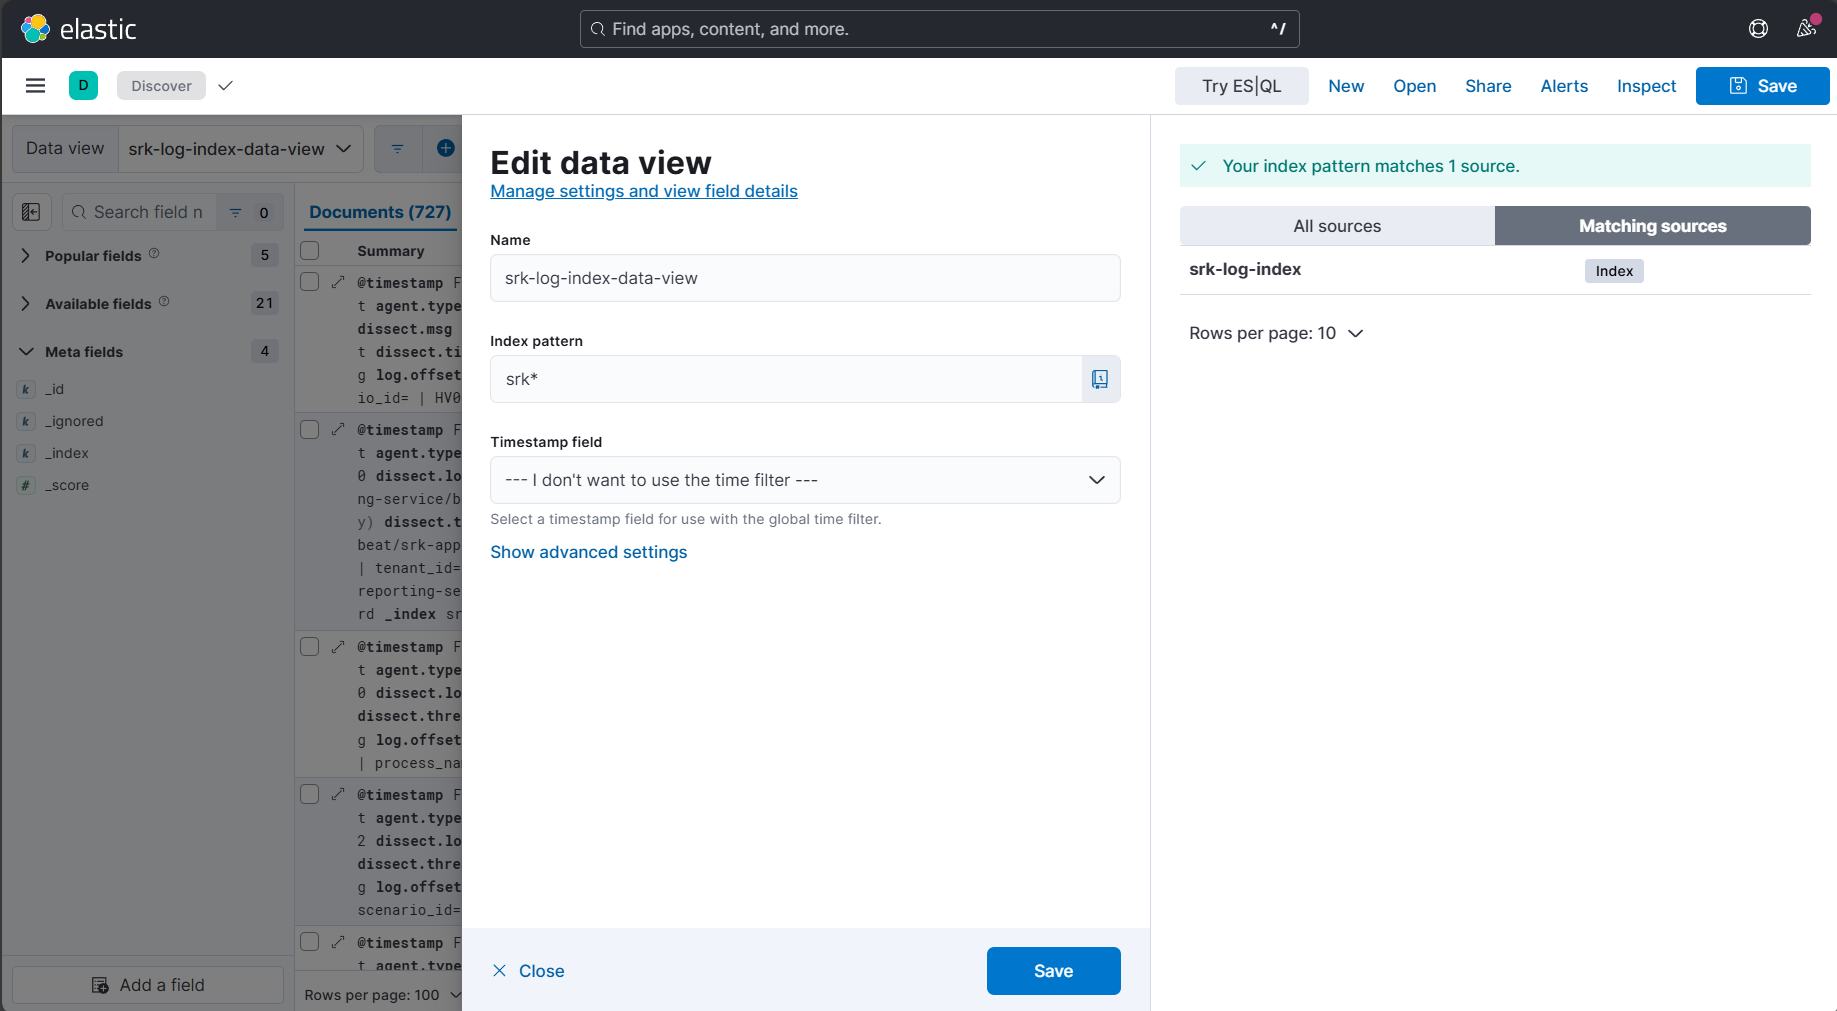
- Goto kibana at http://localhost:5601 -> Analytics -> Discover -> Create a Data view
- Add name to your data view
- Search for your index pattern and it should match the sources as shown in the below image
- Save it
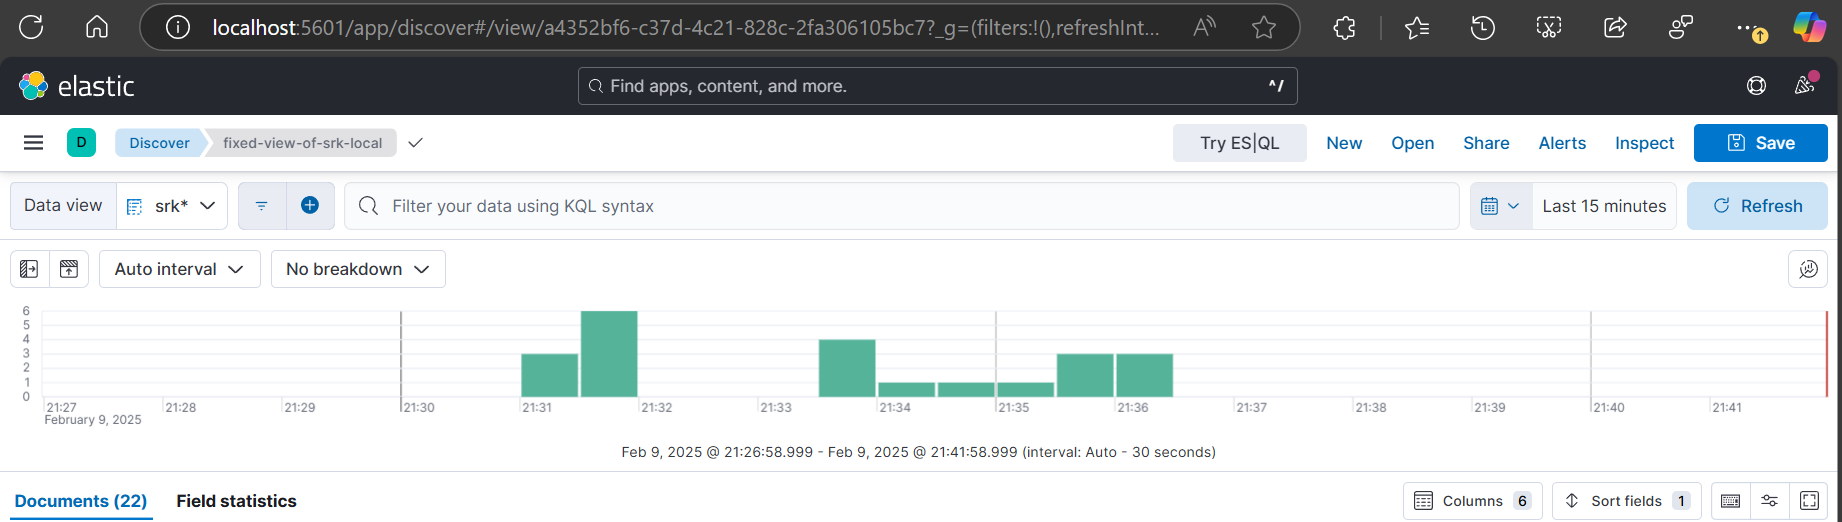
- Setup your preferred cols, arrange them as per your preference like
-
timestamp log_level ..other cols.. msg
-
- As shown in the below image, save your view to preserve your col arrangement
- To filter out data like “country=IN” and “visit_count=1”
-
use keyword suffix when you are sure of the value
- Example: > filter out the logs with country is IN
dissect.country.keyword : “IN”
- Example: > filter out the logs with country is IN
-
use without keyword suffix when you want to search in text field
- Example: > filter out the logs with message containing “welcome” and the visitor country is India
dissect.country.keyword : “IN” and dissect.msg : “welcome”
- Example: > filter out the logs with message containing “welcome” and the visitor country is India
-
- Goto kibana at http://localhost:5601 -> Analytics -> Discover -> Create a Data view
Steps to redo the setup #
- Stop and clean the containers
-
docker-compose down
- Remove all the named volumes(In any order)
-
docker volume rm local-filebeat-elastic-kibana-setup_kibanadata
-
docker volume rm local-filebeat-elastic-kibana-setup_esdata
-
docker volume rm local-filebeat-elastic-kibana-setup_filebeat-data
-
- Bring up the cluster/stack
-
docker-compose up -d
-
-